Controlfrog - Meaningful metrics
Meaningful metrics
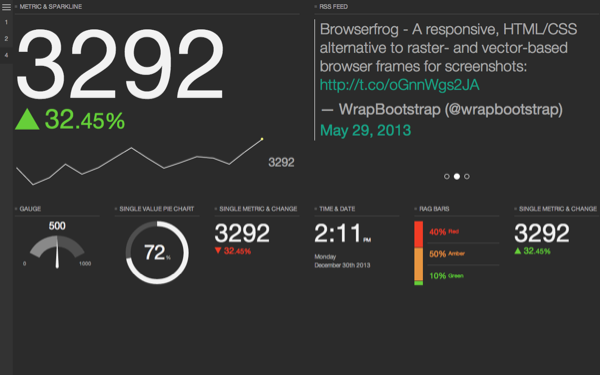
Controlfrog helps you focus on your key metrics by taking them and displaying them in a meaningful, easily digestible way. Equally at home on your phone, tablet, laptop, desktop, TV or huge projector, Controlfrog brings clarity to your data.
Feautres
Fully responsive - all modules work in all layouts at all sizes. There are no predefined fixed width layouts, Controlfrog simply fills as much space as it can.
11 modules - and more on the way, Controlfrog provides plenty of options for displaying your data. Each module is thoroughly tested in each layout, and there are the test pages for you to see, check out the documentation for a complete list.
4 Layouts - Choose from one of four layouts which have been crafted to give your data meaning.
2 styles - Don't like the black theme, no problem go with the white instead!
Optional navigation - Whether you want to use this as a one page site, have multiple Controlfrog pages, or integrate with existing pages, you can! If needed Controlfrog provides a minimal, non obtrusive sidebar/off canvas navigation.
Extensive documentation - Every module explained, from the HTML used to create it as well as any JavaScript used. View the documentation.
11 Interchangeable Modules
Time and date:
Displays the current time and date in either 12hr or 24hr format.
Time and date
Single value metric and change:
Displays a single metric and a value of change, either up or down.
Single value metric and change
Single value metric, change and sparkline:
Displays a single metric, a value of change and a sparkline.
Single value metric, change and sparkline
Single value pie chart / donut:
Displays a single value pie or donut chart.
Single value pie chart / donut
Gauge:
Display a gauge with a needle pointing at a specified number between two bounds.
Gauge
Line chart:
Displays a line chart.
Line chart
Pie chart:
Displays a pie chart with legend.
Pie chart
RSS:
Displays items in a carousel. This implementation shows a how a Twitter feed might appear.
RSS
Funnel chart:
Displays a funnel of n steps with corresponding value and label.
Funnel chart
R.A.G Bars:
Displays a chart with three bars, Red, Amber and Green along with a corresponding value and label.
R.A.G Bars
Yes / No:
Displays either a big 'Yes' or a big 'No'.
Yes / No
Road Map
Development is set to continue with this theme, here are a few things on the todo list:
Media object (such as YouTube, Flickr, Vimeo, Instagram....)
Update function
Realtime charts
If you have any feedback or suggestions on where to go next, please share them with me by emailing froghelp@bengoodyear.com
Changelog
Version 1.2.0
R.A.G Chart Module update as a custom plugin for Controlfrog. Easily create and update R.A.G charts via JavaScript. Create charts with or without bars, create charts with less than, or more than 3 items, use custom colours. Read the full documentation.
Funnel Chart Module updated as a custom plugin for ControlFrog. Easily create and update funnel charts via JavaScript. Create charts with bars on the left or right, with or without bar and metric opacity, create charts with more or less than 5 items, use a custom colour or colours. Read the full documentation.
Version 1.1.0
Navigation added, minimal sidebar and off canvas implementation.
Version 1.0.0
Initial release
Credits
Chart.js
Easy pie chart
Gauge.js
jQuery Sparklines
Moment
You May Also Like